HOW’S MY HAIR?
Information DesignDesign Solutions
09–24–2020
︎ Data Visualization
︎ Layout Design
“How Does My Hair Look?” is a creative example of how data can be showcased as art.
Illustrated below is a chord diagram... Each datapoint on the diagram is represented by a colorful line segment of various waviness / opacity. Each tells you four (4) bites of information: What was being done, Why it was being done, When it was done and the awareness of myself during the data gathering portion of this very revealing project.

Throughout the single days-worth of time depicted above, there shows to be many reasons that I wound up brushing my hand through my long locks.

Bar graph visualizion of the overall number of hair touches
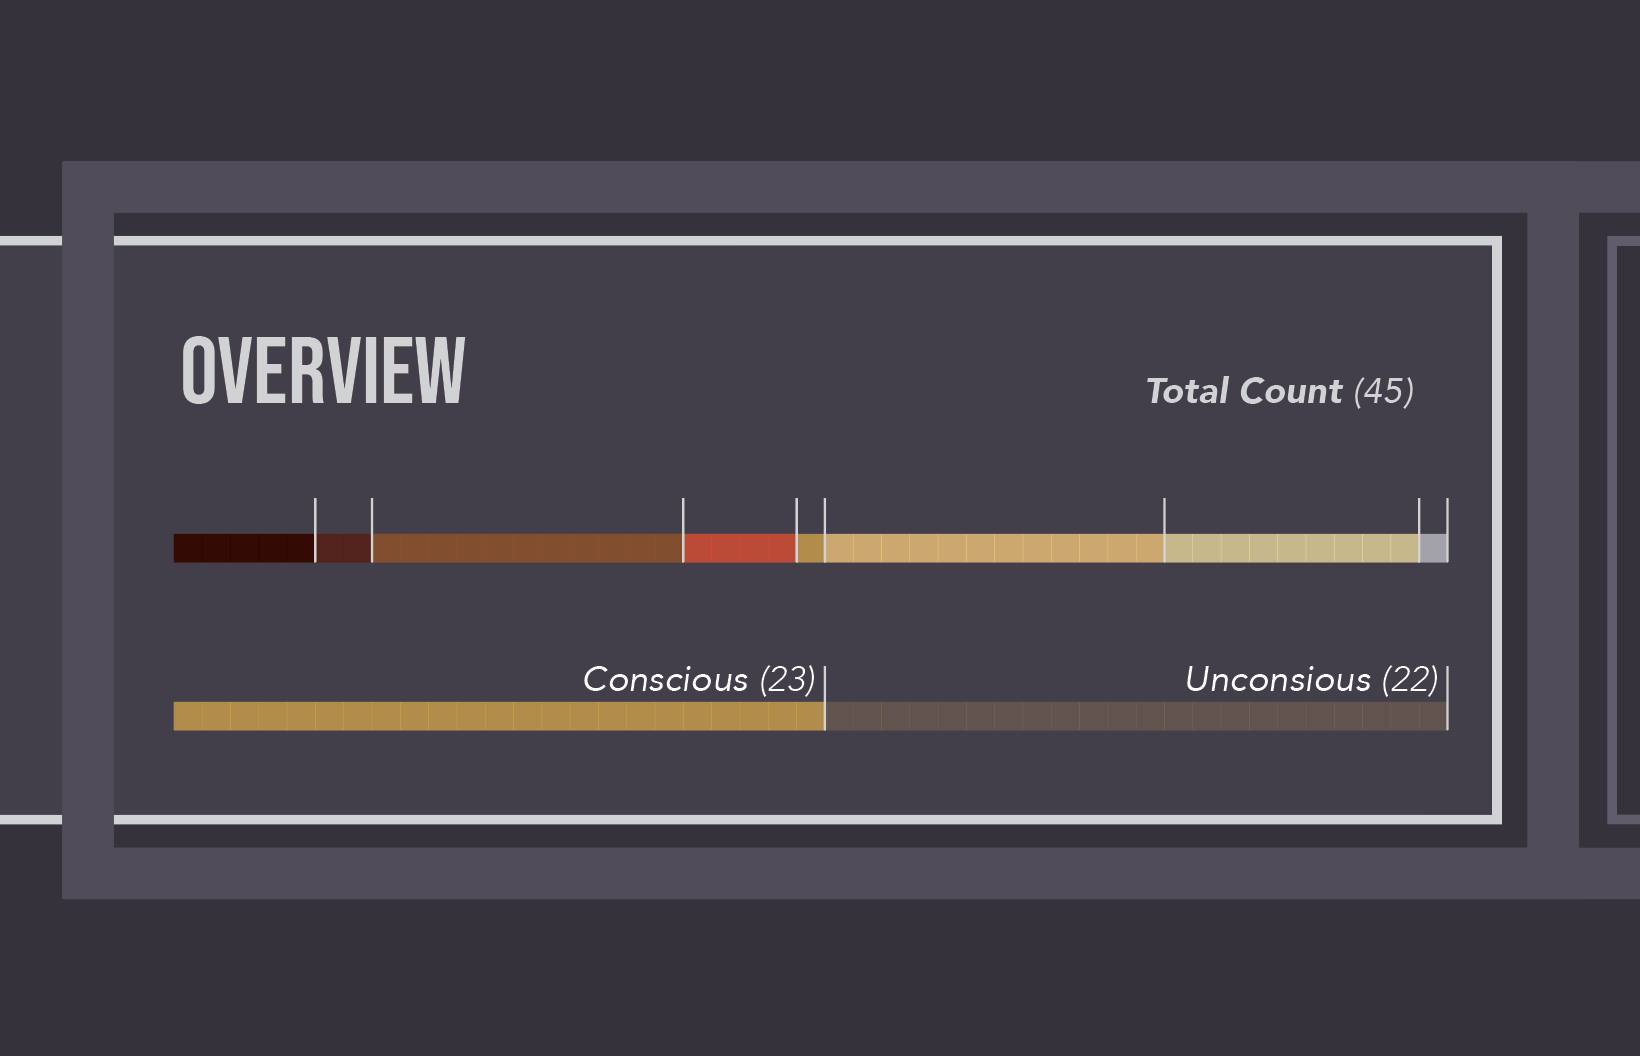
Linear comparison of my awareness + the overall breakdown of hair touches

Data visualization key + variables